
Studentized Range Distribution
The Studentized range distribution is a probability density function parameterized to a number of groups and degrees of freedom.
Description
Consider m groups, all of equal size n, from each of which a normally distributed statistic is calculated. For example, sample means denoted y̅i for each group i.
The general application is that these sample statistics are collected from the sample population, i.e. there is a common population mean and variance. These become important crutches for the formulation of a distribution.
The range between the maximum sample statistic and the minimum sample statistic is itself a statistic q that follows the Studentized range distribution. Continuing to use the example of sample means, and implicitly using a null hypothesis that the difference between population means is 0, the q statistic is calculated as:
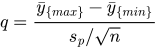
where y̅{max} refers to the maximum of all sample means and sp is a pooled standard deviation. Recall that when samples are of equal size, that formula simplifies to:
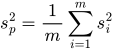
Conceptually, this distribution is a development upon Student's t. It is intuitive to expect that range, or Studentized range (i.e., range normalized by dividing over the standard deviation), will grow with the number of groups. Like a repeated trial, there are simply more opportunities for a rare event. Note however that the Studentized range distribution with m=2 is not equal to Student's t. Continuing to use the example of sample means, the t statistic for a two sample test under these assumptions (i.e., n = n1 = n2) would be calculated as:

This should demonstrate that the two are related, but the Studentized range distribution is larger by a factor of √2.