
|
Size: 1669
Comment: Link
|
Size: 1829
Comment: Rewrite
|
| Deletions are marked like this. | Additions are marked like this. |
| Line 13: | Line 13: |
| The distribution is bell-shaped and parameterized to the [[Statistics/Moments|first and second moments]]. This has useful consequences for estimating the probability that a given value is in the distribution. For example: | The distribution is bell-shaped and parameterized to the [[Analysis/Moment|first and second central moments]]. This has useful consequences for estimating the probability that a given value is in the distribution. For example: |
| Line 19: | Line 19: |
| A variable distributed this way is notated (especially in [[Statistics/EconometricsNotation|econometrics]]) like X ~ N(μ, σ^2^). | A variable distributed this way is notated like ''X ~ N(μ, σ^2^)''. |
| Line 21: | Line 21: |
| When the mean is 0 and the [[Statistics/Variance|variance]] is 1, the p.d.f. is specifically referred to as the '''standard normal distribution'''. This is defined as {{attachment:stdnorm.svg}}. | The probability density function is given (and commonly notated) as: {{attachment:norm.svg}} Correspondingly, the cumulative probability function is commonly notated as ''Φ(.)'' rather than ''F(.)''. === Standard Normal Distribution === The '''standard normal distribution''' is specified as ''Z ~ N(0, 1)''. Compare to the calculation for '''Z scores''' that will be compared to the standard normal distribution: ''Z = (x - μ)/σ''. The probability density function simplifies to: {{attachment:stdnorm.svg}}. This is graphed as: |
| Line 24: | Line 42: |
More generally, the p.d.f. is given by ''f(x) = (1/σ) * φ(x-μ/σ)''. The c.d.f. for the standard normal distribution is notated as ''Φ(.)'', while the c.d.f. for the generic normal distribution is sometimes notated as ''F(.)''. |
|
| Line 35: | Line 49: |
| The [[Statistics/Moments|first and second moments]] are intrinsic to the distribution definition. | The [[Analysis/ExpectedValue|expected value]] is given as ''E[X] = μ''. [[Analysis/Variance|Variance]] is given as ''Var[X] = σ^2^''. |
| Line 47: | Line 63: |
| The standard normal distribution is referenced for '''Z scores''' (alternatively called '''Z statistics'''). As an example, for a two-tailed test and a [[Statistics/TestStatistic|significance level]] of 5%, the critical Z score value is 1.96. | As noted above, '''Z scores''' (alt. ''Z statistics'') are test statistics for which likelihood can be calculated using the standard normal distribution. As an example, for a two-tailed test and a [[Statistics/TestStatistic|significance level]] of 5%, the critical Z score value is 1.96. |
Normal Distribution
The normal distribution is a bell-shaped continuous probability distribution function that is parameterized to a mean and standard deviation.
Contents
Description
The distribution is bell-shaped and parameterized to the first and second central moments. This has useful consequences for estimating the probability that a given value is in the distribution. For example:
- 68.27% of the cumulative distribution is within 1 standard deviation of the mean
- 95.45% within 2
- 99.73% within 3
A variable distributed this way is notated like X ~ N(μ, σ2).
The probability density function is given (and commonly notated) as:

Correspondingly, the cumulative probability function is commonly notated as Φ(.) rather than F(.).
Standard Normal Distribution
The standard normal distribution is specified as Z ~ N(0, 1).
Compare to the calculation for Z scores that will be compared to the standard normal distribution: Z = (x - μ)/σ.
The probability density function simplifies to:
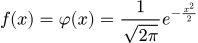 .
.
This is graphed as:

Moments
The expected value is given as E[X] = μ.
Variance is given as Var[X] = σ2.
Usage
Probability Tests
As noted above, Z scores (alt. Z statistics) are test statistics for which likelihood can be calculated using the standard normal distribution.
As an example, for a two-tailed test and a significance level of 5%, the critical Z score value is 1.96.