
Expected Value
The expected value of a random variable is its average, i.e. the value that can be assumed for a finite set of observations without impacting the sum.
Description
For a random variable X, the expected value is usually notated as E[X], E(X), X̅.
More commonly though, a particular distribution function is assumed and the expected value is written in terms appropriate for the corresponding first moment. For example:
for a Normal distribution, μ
for a Bernoulli distribution, p
for a Binomial distribution, np
for a Poisson distribution, λ
for a Uniform distribution, (a+b)/2
- and so on...
Estimation
Definitionally, the sample mean is always an unbiased estimator for the expected value unless the distribution has no defined expected value at all (e.g. the Cauchy distribution).
Properties
Expectations are linear. If the expected value of a random variable X is known, adding a constant to X also adds that constant to the expected value. Multiplying X by a constant factor also multiplies the known variance by that factor. Succinctly: E[aX + b] = a E[X] + b.
Furthermore, the expected value of the sum of two random variables X and Y is the sum of their expected values: E[X + Y] = E[X] + E[Y].
Similarly, if two random variables are independent, then the expected value of their product is the product of their expected values: E[XY] = E[X]E[Y]. This is not true if the two are related; refer to the common formula for covariance: Cov(X, Y) = E[XY] - E[X]E[Y].
Also consider the ratio of two independent random variables: E[X/Y] = E[X]E[1/Y]. Note that this is not equivalent to E[X]/E[Y].
Formulation
Formally, the first moment of a continuous quantitative (numeric) random variable is:

where Ω is the sample space and f is the probability density function for that distribution.
And for a discrete quantitative random variable:

where Ω is the set of possible values and f is the probability mass function for that distribution (although the distributions of discrete random variables are commonly given as tables, rather than mathematical functions).
When working with a distribution given as a table, pairing values of X with a known probability (i.e. there is a function p describing the probability of X taking on the value xi), the most common formulation is:

When working with a set of observations X, where for each observation i there is an observed value xi, the most common formula is:
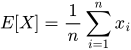
This can be equivalently expressed using a ones-vector j. Let x be the vector of observed values:
(x⃗ · ĵ) 1/n
(xTj) 1/n for a more linear algebraic formulation
(xTIj) 1/n to look more like a quadratic form